Your Pod says Running. Kubernetes says the GPU is allocated. Yet the training job crawls, or vLLM fails the moment it spreads across eight GPUs.
Nothing in Kubernetes looks broken. So where is the problem?
Usually in a layer Kubernetes can’t see: the driver, the CPU socket the GPU is wired to, the network card, or the link between GPUs.
This guide climbs those layers in the order your data crosses them, from one GPU in one Pod to a job spread across nodes:
GPU in a Pod → topology inside the node → network between nodes → GPU-to-GPU traffic
For each layer you get two things: what it is, and what to check when it breaks.
GPU access first#
Start with the checkpoints that make a GPU usable inside a Pod. This is a troubleshooting checklist; the components do not all sit on one runtime data path.
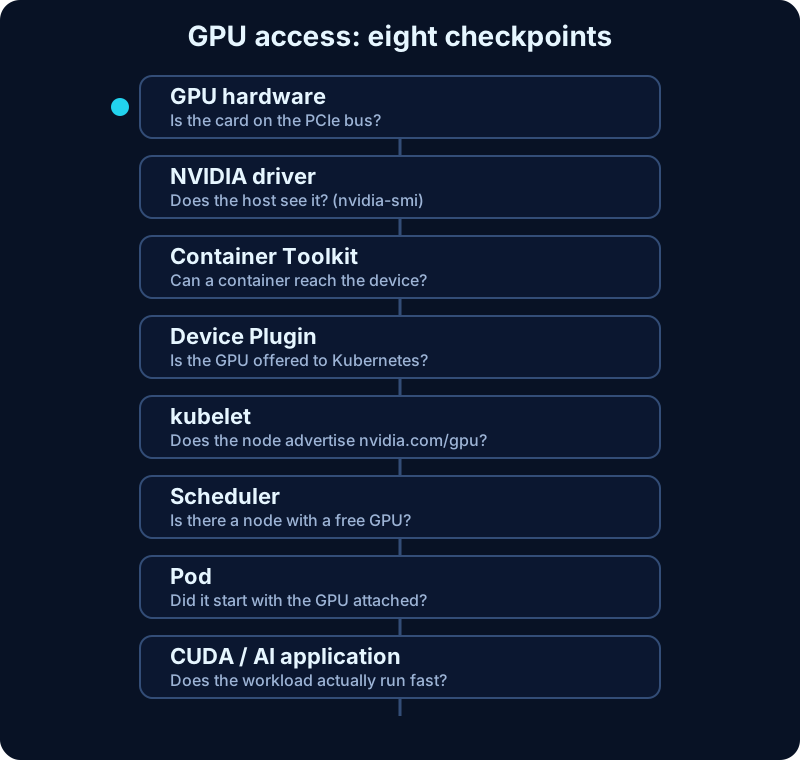
Eight checkpoints from hardware visibility to application performance. Start at the first failing check.
Once the application can use the GPU, the question changes: can it move data fast enough? That takes us beyond this checklist into CPU, memory, GPU, and network locality.
1. NVIDIA GPU Operator and GPU scheduling#
The pieces#
| Piece | What it does |
|---|---|
| NVIDIA driver | Lets the OS talk to the physical GPU |
| Container Toolkit | Lets the container runtime expose the allocated GPU and NVIDIA libraries inside a container |
| Device Plugin | Discovers GPUs and tells kubelet about them |
| GPU Feature Discovery | Adds node labels describing the GPU |
| GPU Operator | Installs and manages most of the above |
Think of it as a hand-off:
(nvidia-smi)"] e1@--> B["Container Toolkit"] B e2@--> C["Container can
access its GPU"] A e3@--> D["Device Plugin"] D e4@--> E["kubelet advertises
nvidia.com/gpu: 8"] E e5@--> F["Scheduler can
count GPUs"] e1@{ animate: true } e2@{ animate: true } e3@{ animate: true } e4@{ animate: true } e5@{ animate: true } classDef k8s fill:#13264a,stroke:#38bdf8,color:#e6f6ff; classDef gpu fill:#173f59,stroke:#22d3ee,color:#ecfeff; classDef net fill:#281d48,stroke:#a78bfa,color:#f1edff; classDef host fill:#302410,stroke:#fbbf24,color:#fff3cf; class A,C gpu; class B,D,E,F k8s;
The driver#
The OS needs a working NVIDIA driver to talk to the GPU. If nvidia-smi fails, start below Kubernetes:
hardware → PCIe → OS → driver
The device plugin and the scheduling request#
The device plugin exposes GPUs as a Kubernetes extended resource:
nvidia.com/gpu: 8
Kubelet then reports that capacity to the control plane. A Pod asks for a GPU like this:
resources:
  limits:
    nvidia.com/gpu: 1
Now the scheduler can choose a node with enough available GPU resources. Kubelet and the device plugin handle allocation of the actual devices on that node.
GPU model awareness#
nvidia.com/gpu is just a count. It does not say H100, H200, or L40S. To target a specific model, use GPU Feature Discovery labels with node affinity, so a rule such as “requires H200 nodes” becomes possible.
The Operator does not schedule#
The GPU Operator does not schedule GPUs.
It installs and manages the software stack (driver, Container Toolkit, Device Plugin, Feature Discovery, monitoring, MIG-related parts, depending on configuration). The Kubernetes scheduler still does the scheduling, using the resources the device plugin advertises.
GPU taints#
You may taint GPU nodes so ordinary workloads stay off them. GPU workloads then need:
GPU request + toleration + affinity or node selection
A toleration means allowed, not forced onto that node.
One Pod, many nodes?#
No. Ordinary Kubernetes scheduling does not split a Pod across nodes. A Pod asking for 8 GPUs needs all 8 on one node. Multi-node workloads use several Pods coordinated by a framework or operator.
MIG#
MIG (Multi-Instance GPU) splits a supported NVIDIA GPU into isolated instances. It helps with smaller workloads, better utilization, and isolation. A job that needs the whole device may still prefer the full GPU.
Troubleshooting tree#
| Symptom | What to check |
|---|---|
nvidia-smi fails | Hardware, PCIe, driver, OS |
nvidia-smi works, nvidia.com/gpu missing | Device plugin, kubelet registration, GPU Operator integration, runtime integration |
nvidia.com/gpu exists, Pod Pending | GPU capacity, CPU/RAM, taints, node affinity, topology, storage, cordon, other scheduler constraints |
| Pod scheduled, no GPU inside the container | Container Toolkit, runtime configuration, device allocation, driver compatibility |
| GPU visible, but NCCL or vLLM fails | CUDA libraries, NCCL, topology, distributed network, RDMA |
Also watch more than utilization: GPU memory, temperature, power, health or errors, and allocation.
Burn this into memory#
nvidia-smi          = host sees GPU
Device Plugin       = Kubernetes sees GPU
nvidia.com/gpu      = scheduler can account for GPU
Container Toolkit   = container can access GPU
GPU Operator        = manages the NVIDIA Kubernetes GPU software lifecycle
2. NUMA and PCIe topology#
A visible GPU is only the first check. Next, look at the route data takes to reach it.
What is NUMA?#
NUMA means Non-Uniform Memory Access. Many large servers have several CPU sockets, each with its own local memory. A socket can also contain more than one NUMA node; the two-socket example below is a simplified layout. Reading local memory is generally faster than reading memory attached to the other socket.
NUMA Node 0                 NUMA Node 1

CPU Socket 0                CPU Socket 1
   │                            │
Local RAM                    Local RAM
Why it matters for AI#
GPUs and NICs hang off a specific socket too:
CPU Socket 0                 CPU Socket 1
 ├── RAM 0                    ├── RAM 1
 ├── GPU 0                    ├── GPU 2
 ├── GPU 1                    ├── GPU 3
 └── NIC 0                    └── NIC 1
A good path keeps everything together: CPU0 + RAM0 + GPU0 + NIC0. A bad path makes data cross sockets, adding latency and eating inter-socket bandwidth.
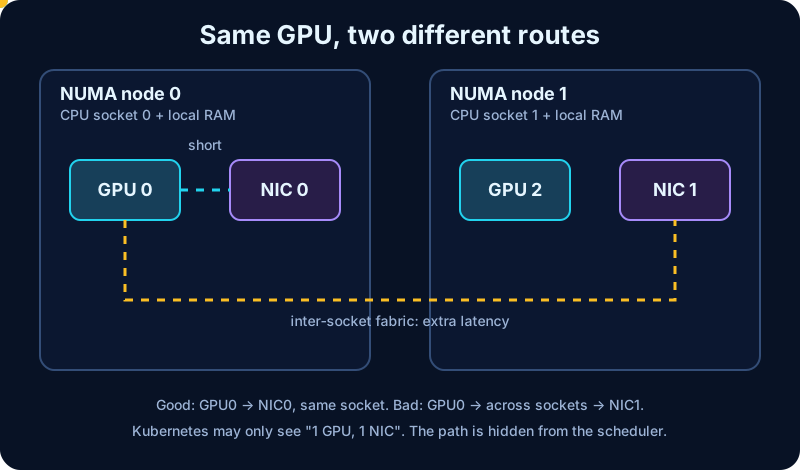
Same GPU, same NIC count. The route is what changes.
PCIe#
PCIe is the general-purpose high-speed connection between the CPU and devices such as GPUs, NICs, and NVMe drives.
CPU
 ├── PCIe → GPU
 ├── PCIe → NIC
 └── PCIe → NVMe
Kubernetes and topology#
With the conventional device-plugin setup described here, the default scheduler mainly sees resource counts, rather than the socket of each GPU. Fine-grained locality is handled on the node, by kubelet and its configured resource managers:
| Piece | Role |
|---|---|
| Topology Manager | Collects hints from resource managers so CPU and device allocations line up when possible |
| CPU Manager | With the static policy, containers in Guaranteed Pods with whole-number CPU requests can get exclusive CPUs |
| Memory Manager | With the Static policy, provides NUMA-aware memory allocation for Guaranteed Pods |
| Guaranteed QoS | CPU and memory requests equal their limits in every container; required for exclusive CPU allocation |
Guaranteed QoS alone does not align resources. The node needs the relevant manager policies and device topology hints. A strict Topology Manager policy can reject a Pod on the node if its locality requirements cannot be met. See the Kubernetes resource manager guide and Topology Manager policies.
Two more places locality shows up:
- SR-IOV: a VF inherits locality from its parent NIC. If the GPU is near NUMA 0 but the VF is near NUMA 1, traffic crosses sockets.
- GPUDirect RDMA: it benefits from a sensible GPU and NIC PCIe/NUMA layout.
Useful commands#
lscpu
numactl --hardware
nvidia-smi topo -m
nvidia-smi topo -m prints a matrix of how every GPU and NIC connects to the others. It is the quickest way to see the real topology.
Performance troubleshooting order#
Burn this into memory#
NUMA              = CPU/memory locality
PCIe              = device connection path
Topology Manager  = coordinates resource locality on the node
CPU Manager       = can assign exclusive CPUs
Memory Manager    = can align memory with NUMA locality
3. RDMA, InfiniBand, RoCE, ConnectX#
Locality matters within a server. Once a job spans servers, the network becomes part of the GPU communication path too.
What is RDMA?#
RDMA means Remote Direct Memory Access. It lets one server read or write another server’s registered memory with very little CPU and kernel involvement.
Server A memory ↔ RDMA ↔ Server B memory
The key point:
RDMA is a communication capability, not a network type by itself.
Why distributed AI benefits from it#
Distributed GPU jobs move huge amounts of data. If the network is slow, the GPU waits, and an expensive accelerator sits idle. This matters for tensor parallelism, training collectives, model parallelism, and large inference workloads.
The names#
| Name | One line |
|---|---|
| RDMA | The communication model |
| InfiniBand | A purpose-built HPC fabric that supports RDMA |
| RoCE | RDMA over Converged Ethernet: RDMA on an Ethernet network |
| ConnectX | NVIDIA’s family of high-performance network adapters |
| NCCL | NVIDIA Collective Communications Library, the software that moves GPU data |
GPUDirect RDMA#
Without GPUDirect RDMA, data is staged through host memory on both servers:
Server A: GPU memory → host memory → RDMA NIC
                                       ↓
                              InfiniBand / RoCE
                                       ↓
Server B: GPU memory ← host memory ← RDMA NIC
With GPUDirect RDMA, the sending NIC reads GPU memory directly and the receiving NIC writes directly into the other GPU’s memory. Both paths below use RDMA across the network; the difference is whether they need host-memory staging.
GPU memory"] e1@-->|GPU-to-host copy| H1["Server A
Host memory"] H1 e2@--> N1["Server A
RDMA NIC"] N1 e3@--> F1["InfiniBand / RoCE fabric"] F1 e4@--> N2["Server B
RDMA NIC"] N2 e5@--> H2["Server B
Host memory"] H2 e6@-->|Host-to-GPU copy| G2["Server B
GPU memory"] end subgraph D["With GPUDirect RDMA"] direction TB G3["Server A
GPU memory"] e7@-->|Direct PCIe access| N3["Server A
RDMA NIC"] N3 e8@--> F2["InfiniBand / RoCE fabric"] F2 e9@--> N4["Server B
RDMA NIC"] N4 e10@-->|Direct PCIe access| G4["Server B
GPU memory"] end e1@{ animate: true } e2@{ animate: true } e3@{ animate: true } e4@{ animate: true } e5@{ animate: true } e6@{ animate: true } e7@{ animate: true } e8@{ animate: true } e9@{ animate: true } e10@{ animate: true } S ~~~ D classDef gpu fill:#173f59,stroke:#22d3ee,color:#ecfeff; classDef net fill:#281d48,stroke:#a78bfa,color:#f1edff; classDef host fill:#302410,stroke:#fbbf24,color:#fff3cf; class G1,G2,G3,G4 gpu; class H1,H2 host; class N1,N2,N3,N4,F1,F2 net;
Topology still matters here. A GPU and NIC far apart lose much of the benefit.
RoCE needs a careful network#
RDMA over Ethernet only behaves well on a carefully engineered network. Terms worth recognizing: PFC, ECN, DCQCN. The idea is congestion and loss management so RDMA stays fast and predictable.
Pod networking for AI#
One common design for a distributed AI Pod uses two interfaces:
eth0 = normal Kubernetes networking
net1 = high-performance RDMA interface
One way to build that second path is Multus + SR-IOV + an RDMA-capable VF. Other deployments use shared RDMA devices or host networking. The next section explains the VF design; section 5 shows how NCCL uses the available paths.
Troubleshooting distributed performance#
| Symptom | Think about |
|---|---|
| Single node works, multi-node is bad | NCCL transport, RDMA interfaces, ConnectX, link speed, errors and drops, congestion, GPUDirect, NUMA/PCIe topology, fabric |
| Normal Pod network works, distributed GPU communication fails | The secondary RDMA path may be broken while ordinary CNI is fine: VF allocation, RDMA device visibility, ConnectX health, RoCE or InfiniBand, NCCL |
Burn this into memory#
RDMA            = low-overhead remote memory communication
InfiniBand      = HPC fabric supporting RDMA
RoCE            = RDMA over Ethernet
ConnectX        = high-performance adapter
GPUDirect RDMA  = efficient GPU memory ↔ RDMA NIC communication
4. SR-IOV, Multus, DPU, SmartNIC#
SR-IOV#
SR-IOV means Single Root I/O Virtualization. One physical PCIe device exposes many hardware-backed virtual functions.
Physical NIC
    │
    ├── PF
    ├── VF1
    ├── VF2
    ├── VF3
    └── VF4
- PF (Physical Function): the full physical function, visible to the host. It configures SR-IOV and creates VFs.
- VF (Virtual Function): a lightweight PCIe function that can be handed to a workload.
A NIC exposes a finite number of VFs, and Kubernetes treats them as schedulable resources.
The Kubernetes SR-IOV stack#
with VF capacity"] E e5@--> K["kubelet + Device Plugin
allocate a VF"] K --> F["SR-IOV CNI"] F e6@--> G["VF configured in the Pod network namespace"] e1@{ animate: true } e2@{ animate: true } e3@{ animate: true } e4@{ animate: true } e5@{ animate: true } e6@{ animate: true } classDef k8s fill:#13264a,stroke:#38bdf8,color:#e6f6ff; classDef gpu fill:#173f59,stroke:#22d3ee,color:#ecfeff; classDef net fill:#281d48,stroke:#a78bfa,color:#f1edff; classDef host fill:#302410,stroke:#fbbf24,color:#fff3cf; class A,B,G net; class C,D,E,K,F k8s;
Do not mix up the two:
Device Plugin = discover / advertise / allocate the device resource
SR-IOV CNI    = attach / configure the network interface
Multus#
Multus is a meta-CNI. It lets a Pod have more than one network attachment.
API, DNS, Services"] S e6@--> R["VF / RDMA
high-performance traffic"] e1@{ animate: true } e2@{ animate: true } e3@{ animate: true } e4@{ animate: true } e5@{ animate: true } e6@{ animate: true } classDef k8s fill:#13264a,stroke:#38bdf8,color:#e6f6ff; classDef gpu fill:#173f59,stroke:#22d3ee,color:#ecfeff; classDef net fill:#281d48,stroke:#a78bfa,color:#f1edff; classDef host fill:#302410,stroke:#fbbf24,color:#fff3cf; class P,E0,C,K k8s; class N1,S,R net;
In this design, the traffic is separated like this:
eth0 = API / DNS / Services / management traffic
net1 = high-performance RDMA traffic
SR-IOV is not RDMA#
SR-IOV gives a Pod a direct-ish, hardware-backed virtual interface. RDMA needs a suitable NIC, firmware and driver, RDMA stack, and fabric. They often work together, but they are different things.
Troubleshooting#
| Symptom | Think about |
|---|---|
Pod Pending: Insufficient <sriov-resource> | No allocatable VF, a resource advertisement problem, device plugin issue, or scheduler constraints |
| Pod scheduled but no secondary interface | Multus, NetworkAttachmentDefinition, SR-IOV CNI, configuration |
net1 exists but RDMA fails | VF driver, RDMA device exposure, RoCE or InfiniBand, NCCL, fabric |
| Device plugin unhealthy | VF resources may vanish from Kubernetes accounting |
| PF down | Many VFs can be affected at once |
SmartNIC vs DPU#
- SmartNIC: a programmable, high-performance NIC that can offload networking, security, or storage work.
- DPU: a more capable infrastructure processor: NIC + onboard CPU cores + offload engines. NVIDIA BlueField is a common example.
ConnectX   = high-performance NIC
BlueField  = DPU with networking + onboard compute/offload
These are optional infrastructure components in this story. A DPU does not replace the GPU:
GPU = model compute
DPU = infrastructure / network / security / storage offload
Burn this into memory#
Multus         = multiple interfaces
SR-IOV         = hardware virtualization through PF/VFs
Device Plugin  = advertise/allocate VF
SR-IOV CNI     = attach/configure VF
ConnectX       = high-speed NIC
BlueField      = NIC + onboard compute/offload
RDMA           = communication capability
5. NVLink, NVSwitch, NCCL#
We now have GPU access, local topology, and a path between servers. NCCL brings those pieces together for communication between GPUs.
Large AI workloads need GPUs to swap data quickly: activations, partial results, gradients, tensor-parallel data.
The links#
| Piece | What it is |
|---|---|
| PCIe | General-purpose device interconnect |
| NVLink | NVIDIA’s high-bandwidth interconnect for supported GPUs, faster and more specialized than PCIe |
| NVSwitch | A switching fabric that connects many NVLink GPUs. It is not an Ethernet switch |
| NCCL | The software library that does the actual GPU communication |
GPU0 ─┐
GPU1 ─┼── NVSwitch fabric
GPU2 ─┼
GPU3 ─┘
NCCL collectives#
NCCL provides optimized group operations:
| Operation | What happens |
|---|---|
| AllReduce | Everyone contributes values, everyone receives the reduced result |
| AllGather | Everyone gathers everyone’s pieces |
| ReduceScatter | Data is reduced, then split across participants |
| Broadcast | One participant sends data to all |
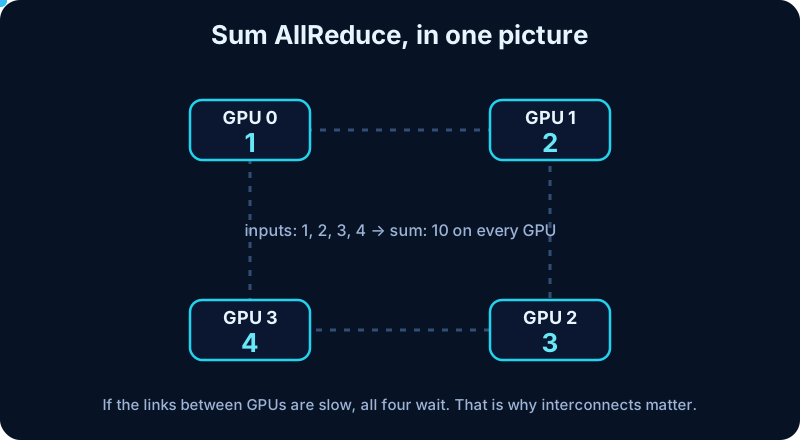
Sum AllReduce: each GPU contributes a value and every GPU gets 10. This illustrates the result, not the full ring algorithm.
Which path does NCCL use?#
NCCL sits above the physical paths and selects transports based on topology, support, and configuration:
- Same server: NVLink, NVSwitch, or PCIe, depending on topology.
- Across servers, with GPUDirect RDMA: GPU → RDMA NIC (such as ConnectX) → InfiniBand or RoCE → RDMA NIC → GPU.
- Fallback paths: RDMA can use host-memory staging when direct GPU access is unavailable, and NCCL can use IP sockets when the RDMA transport is unavailable or disabled. A working job does not prove it is using the fast path.
Set NCCL_DEBUG=INFO on a diagnostic run and inspect the selected network transport. Compare a collective benchmark such as nccl-tests on one node and across nodes with the same GPU count and message sizes. The NCCL environment variable reference describes transport controls and debug logging.
vLLM and tensor parallelism#
Tensor-parallel execution needs constant GPU-to-GPU communication. With a weak interconnect, the model becomes communication-bound: the GPUs have capacity, but they spend their time waiting on each other.
Narrow it down by scale#
| What works | What fails | Think about |
|---|---|---|
| Nothing | One GPU | GPU, driver, CUDA, app |
| One GPU | 8 GPUs, same node | NCCL, NVLink/NVSwitch, PCIe/topology |
| 8 GPUs, same node | Multi-node | NCCL, RDMA, ConnectX, RoCE or InfiniBand, fabric |
This is the trap to remember:
Pod Running  ✓
GPU allocated ✓
AI performance still terrible
Kubernetes can look perfectly healthy while the bottleneck sits in the communication path below the application.
Burn this into memory#
PCIe            = general device interconnect
NVLink          = high-bandwidth NVIDIA GPU/device link
NVSwitch        = switching fabric for NVLink GPUs
NCCL            = optimized GPU collective communication library
ConnectX        = high-performance NIC
RDMA            = low-overhead remote memory communication
GPUDirect RDMA  = efficient GPU ↔ NIC path
The one-page version#
When a GPU workload misbehaves, walk up the layers and stop at the first one that fails.
| Layer | Question | First tool |
|---|---|---|
| Driver | Does the host see the GPU? | nvidia-smi |
| Device Plugin | Does Kubernetes see it? | Node allocatable: nvidia.com/gpu |
| Container Toolkit | Can the container use it? | nvidia-smi inside the Pod |
| Topology | Are GPU, CPU, and NIC close together? | nvidia-smi topo -m, numactl --hardware |
| Multus + SR-IOV | Does the Pod have net1? | ip a in the Pod |
| RDMA | Does the fast path work? | rdma link, ibv_devinfo, fabric counters |
| NCCL | Do the GPUs talk fast? | NCCL logs and tests, single node then multi-node |
The GPU is only one part of the platform. Most of the hard problems live in the paths between the parts.
Related posts: to practice GPU scheduling without any hardware, try the laptop GPU simulation lab.