
My llm-d post ended with a 16-GPU reference setup: 8 vLLM replicas on 2 H100s each.
I don’t have 16 H100s. I have a MacBook.
You don’t need GPUs to learn routing, scheduling, and failure modes. You need things that behave like GPUs and behave like vLLM. This post builds that lab end to end on a laptop, then uses it to answer a real question:
Does llm-d beat a plain Kubernetes Service, and when does it lose?
Spoiler: it won 3x on throughput for one traffic pattern and lost 5x on another, until I tuned two knobs. I found all of that on a laptop in an evening.
Tested on an Apple M4 (32 GB), Colima 0.10.3, kind v0.33.0 (Kubernetes v1.37.0), fake-gpu-operator 0.2.1, llm-d-inference-sim v0.11.4, and the llm-d router v0.10.0. Every screenshot is from that run.
What’s real, what’s fake#
The trick is to fake only the two expensive layers: the GPU and the model. Everything above them is the real software you’d run in production.
OpenAI API calls"] e1@--> E["Envoy proxy"] E e2@-->|"which pod?"| R["llm-d router (EPP)
filter, score, pick"] R e3@--> P["InferencePool
8 model server pods"] P e4@--> V["llm-d-inference-sim
acts like vLLM"] V e5@--> G["fake-gpu-operator
16 x H100 80GB"] G e6@--> K["kind nodes
Docker containers"] K e7@--> M["Colima VM on a Mac"] e1@{ animate: true } e2@{ animate: true } e3@{ animate: true } e4@{ animate: true } e5@{ animate: true } e6@{ animate: true } e7@{ animate: true } classDef real fill:#173f59,stroke:#22d3ee,color:#ecfeff; classDef router fill:#281d48,stroke:#a78bfa,color:#f1edff; classDef fake fill:#302410,stroke:#fbbf24,color:#fff3cf,stroke-dasharray:6 4; classDef base fill:#101e27,stroke:#324950,color:#8aa0a8; class C,E,P real; class R router; class V,G fake; class K,M base;
| Layer | Real thing | In this lab | What still works |
|---|---|---|---|
| GPU | NVIDIA device plugin + driver | fake-gpu-operator | nvidia.com/gpu scheduling, nvidia-smi, DCGM metrics |
| Model server | vLLM | llm-d-inference-sim | OpenAI API, streaming, prefix cache, TTFT, vllm:* metrics |
| Router | llm-d EPP + Envoy | the real thing | Every routing decision |
| Cluster | GPU nodes | kind on Colima | Real Kubernetes v1.37 |
The router has two parts, and you’ll see both names a lot below:
- EPP (Endpoint Picker) is the decision-maker. For each request it checks every model server pod (what’s in its prefix cache, how much work it has queued) and picks one. It doesn’t carry traffic itself.
- Envoy is the proxy that carries the traffic. It asks the EPP “which pod?”, then forwards the request there.
The EPP is a Gateway API Inference Extension component; llm-d ships its own build with extra routing plugins.
A few more terms that come up often:
- TTFT (time to first token): how long a user waits before the first word of the answer appears. Mostly the time to read the prompt (prefill).
- Prefix cache: vLLM keeps the processed start of recent prompts in GPU memory. A new request that starts the same way skips that work, so TTFT drops. It only helps on the pod that holds the cache.
- InferencePool: a Kubernetes resource that groups the model server pods, like a Service that knows it’s serving a model.
- DCGM: NVIDIA’s GPU monitoring tool. Its exporter publishes GPU metrics to Prometheus.
- p50 / p90: the median request, and the request slower than 90% of the others. p90 shows what your unlucky users feel.
The lab#
Three kind nodes. The two workers each pretend to have 8 H100s. Eight simulated vLLM pods take 2 GPUs each, the same shape as the llm-d reference guide.
loadtest.py"] c1@--> EPP["sim-lab-epp
Envoy + EPP"] CL -.->|"baseline"| SVC["Service qwen3-32b
kube-proxy"] EPP c2@--> W1["gpu-sim-worker
8 x fake H100
4 sim pods x 2 GPU"] EPP c3@--> W2["gpu-sim-worker2
8 x fake H100
4 sim pods x 2 GPU"] SVC -.-> W1 SVC -.-> W2 c1@{ animate: true } c2@{ animate: true } c3@{ animate: true } classDef gpu fill:#173f59,stroke:#22d3ee,color:#ecfeff; classDef router fill:#281d48,stroke:#a78bfa,color:#f1edff; classDef input fill:#13264a,stroke:#38bdf8,color:#e6f6ff; classDef idle fill:#101e27,stroke:#324950,color:#8aa0a8; class W1,W2 gpu; class EPP router; class CL input; class SVC idle;
The client pod sends identical traffic to two targets: the plain Service (baseline) and the llm-d router. Same pods, same prompts, different routing.
Step 1: a cluster with nodes that want GPUs#
Start Docker. I gave Colima 6 CPUs and 12 GB. The whole lab used a fraction of that.
colima start --cpu 6 --memory 12 --disk 60
brew install kind
Label the two workers so the fake GPU operator knows which nodes to “install” GPUs on:
# kind-config.yaml
kind: Cluster
apiVersion: kind.x-k8s.io/v1alpha4
name: gpu-sim
nodes:
- role: control-plane
- role: worker
  labels:
    run.ai/simulated-gpu-node-pool: h100
- role: worker
  labels:
    run.ai/simulated-gpu-node-pool: h100
kind create cluster --config kind-config.yaml

Each Kubernetes node is just a Docker container running kindest/node:v1.37.0.
Gotcha on Colima: if
kindorhelmfails withdocker-credential-osxkeychain: executable file not found, your~/.docker/config.jsonstill points at Docker Desktop’s credential helper. Eitherbrew install docker-credential-helper, or pointDOCKER_CONFIGat a folder with an empty{}config.json. For Helm OCI pulls, also setHELM_REGISTRY_CONFIGto that file.
Step 2: install 16 fake H100s#
fake-gpu-operator (from Run:ai, now NVIDIA) replaces the NVIDIA GPU stack with fakes. It runs a device plugin that advertises nvidia.com/gpu, a fake nvidia-smi, and a DCGM exporter with GPU metrics.
The operator ships GPU profiles: a100, h100, b200, gb200, gb300, l40s, t4. Pick one per node pool:
# fake-gpu-values.yaml
topology:
  nodePools:
    h100:            # matches the node label value
      gpu:
        backend: fake
        profile: h100
helm upgrade -i gpu-operator \
  oci://ghcr.io/run-ai/fake-gpu-operator/fake-gpu-operator \
  --version 0.2.1 -n gpu-operator --create-namespace \
  -f fake-gpu-values.yaml
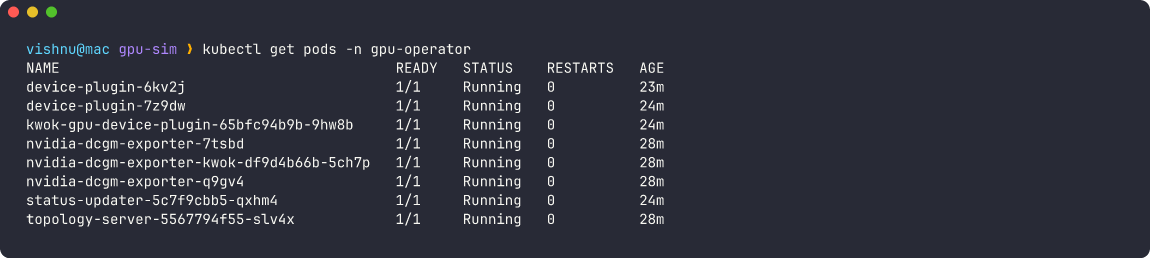
A device plugin and a DCGM exporter on each GPU node, plus the status updater and topology server.
About a minute later, the workers report GPUs. The h100 profile gives each node 8 GPUs with 81,920 MiB each:

Two workers, each with 8 NVIDIA-H100-80GB-HBM3. The control plane has none, as on a real cluster.
Ask for 2 GPUs from a plain ubuntu:24.04 pod and run nvidia-smi:
# gpu-test-pod.yaml
apiVersion: v1
kind: Pod
metadata:
  name: gpu-test
spec:
  restartPolicy: Never
  containers:
  - name: cuda
    image: ubuntu:24.04
    command: ["sh", "-c", "nvidia-smi && sleep 3600"]
    resources:
      limits:
        nvidia.com/gpu: 2
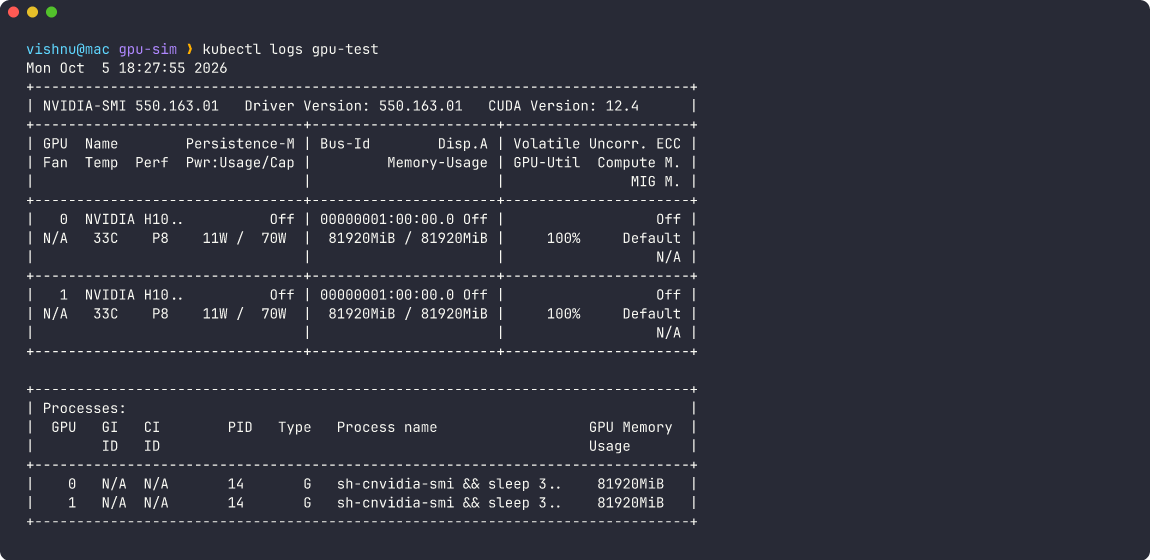
nvidia-smi inside a stock Ubuntu image, with no driver and no CUDA. The device plugin mounts a fake binary.
That is enough to test quotas, Kueue, bin-packing, node affinity, and GPU dashboards. It is not enough to run CUDA code. There is no GPU behind it.
Step 3: 8 simulated vLLM pods#
llm-d-inference-sim is a small Go server that acts like vLLM. It serves the same OpenAI endpoints and the same vllm:* Prometheus metrics, and it keeps a real prefix cache, so a repeated prompt is faster the second time.
Its latency model is the part that makes routing experiments meaningful:
3,833 prompt tokens"] e1@--> C{"Prefix cache
on this pod?"} C e2@-->|"miss"| M["Prefill
20 ms + 3,833 x 0.2 ms
≈ 790 ms"] C e3@-->|"hit"| H["Prefill
20 ms + 9 x 0.2 ms
≈ 22 ms"] M e4@--> D["Decode
15 ms per token"] H e5@--> D e1@{ animate: true } e2@{ animate: true } e3@{ animate: true } e4@{ animate: true } e5@{ animate: true } classDef input fill:#13264a,stroke:#38bdf8,color:#e6f6ff; classDef router fill:#281d48,stroke:#a78bfa,color:#f1edff; classDef warn fill:#302410,stroke:#fbbf24,color:#fff3cf; classDef gpu fill:#173f59,stroke:#22d3ee,color:#ecfeff,stroke-width:3px; class Q input; class C router; class M warn; class H,D gpu;
Here is the Deployment. Each flag maps to a vLLM concept:
# vllm-sim.yaml
apiVersion: apps/v1
kind: Deployment
metadata:
  name: qwen3-32b-sim
  namespace: llm-d-sim
spec:
  replicas: 8
  strategy:
    rollingUpdate:
      maxSurge: 0          # no spare GPUs for a surge pod
      maxUnavailable: 1    # replace one replica at a time
  selector:
    matchLabels:
      app: qwen3-32b-sim
  template:
    metadata:
      labels:
        app: qwen3-32b-sim
        llm-d.ai/guide: sim-lab          # the router selects pods by this label
    spec:
      containers:
      - name: vllm
        image: ghcr.io/llm-d/llm-d-inference-sim:v0.11.4
        args:
        - --model=Qwen/Qwen3-32B          # name only; no weights are loaded
        - --port=8000
        - --max-num-seqs=4                # concurrent "running" requests per pod
        - --max-model-len=16384
        - --enable-kvcache                # track prefix-cache blocks like vLLM
        - --kv-cache-size=1024            # 1024 blocks x 16 = 16k tokens per pod
        - --block-size=16
        - --latency-calculator=per-token  # prefill cost scales with uncached tokens
        - --prefill-overhead=20ms
        - --prefill-time-per-token=200us  # 4,000 uncached tokens ≈ 0.8 s TTFT
        - --inter-token-latency=15ms
        - --time-factor-under-load=2.0
        env:
        - name: POD_NAME                  # sim echoes this in x-inference-pod
          valueFrom:
            fieldRef:
              fieldPath: metadata.name
        - name: POD_NAMESPACE
          valueFrom:
            fieldRef:
              fieldPath: metadata.namespace
        - name: POD_IP                    # required when --enable-kvcache is set
          valueFrom:
            fieldRef:
              fieldPath: status.podIP
        ports:
        - name: http
          containerPort: 8000
        readinessProbe:
          httpGet:
            path: /health
            port: 8000
        resources:
          requests:
            cpu: 50m
            memory: 64Mi
          limits:
            nvidia.com/gpu: 2             # fake H100s from fake-gpu-operator
---
apiVersion: v1
kind: Service
metadata:
  name: qwen3-32b
  namespace: llm-d-sim
spec:
  selector:
    app: qwen3-32b-sim
  ports:
  - name: http
    port: 8000
    targetPort: 8000
Two choices are deliberate:
- Small KV cache (16k tokens per pod). It holds about four 3,800-token system prompts, so cache placement matters.
- Low
max-num-seqs(4). Real vLLM batches far more requests. I set it low so a laptop can drive a pod into saturation.
kubectl create namespace llm-d-sim
kubectl apply -f vllm-sim.yaml
Each pod uses 50m of CPU and 64 Mi of memory, but the scheduler places them by GPU: 4 pods × 2 GPUs fill each node.
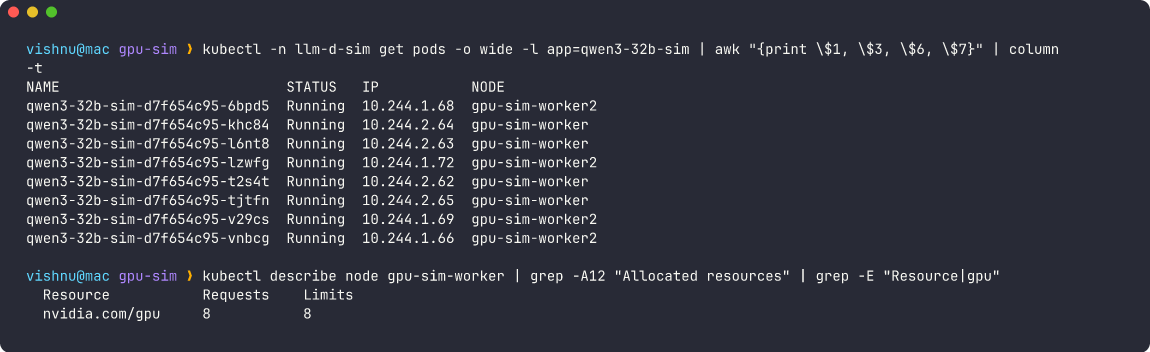
Eight replicas, four per node. Each worker has all 8 GPUs allocated.
Now ask for a ninth replica:
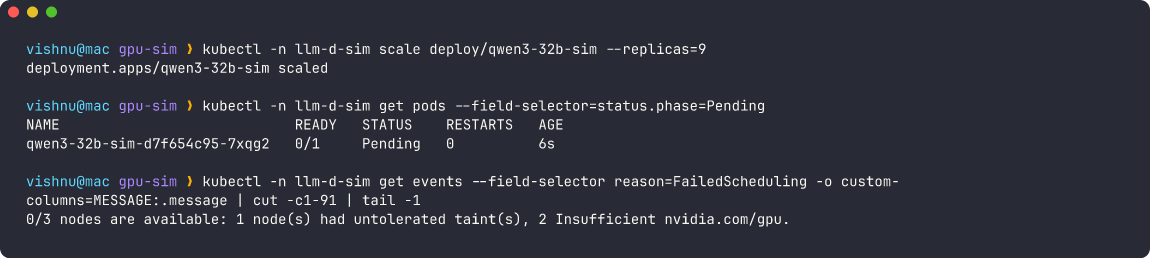
The ninth replica stays Pending: Insufficient nvidia.com/gpu. Fake GPUs, real scheduling.
This is why the Deployment sets maxSurge: 0. With default settings, my first rollout stalled: the new pods needed GPUs held by the old pods they were meant to replace. You’d hit the same thing on a full GPU cluster, and here it costs nothing to find.
Gotcha: the sim crashed on startup with
IP should be defined in the environment (POD_IP) for KV cache to work.--enable-kvcacheneeds thePOD_IPenv var, which is why it is in the manifest above.
Step 4: install the real llm-d router#
Install the Gateway API Inference Extension CRDs, then the llm-d router chart in standalone mode (Envoy runs as a sidecar of the EPP).
kubectl apply -f https://github.com/kubernetes-sigs/gateway-api-inference-extension/releases/download/v1.6.2/v1-manifests.yaml
The chart’s defaults request 8 CPUs for the EPP and 4 for Envoy. These values shrink that and use the same plugin chain as the optimized baseline guide:
# router-values.yaml
router:
  extraServicePorts:
  - name: http
    port: 80
    protocol: TCP
    targetPort: 8081
  modelServers:
    matchLabels:
      llm-d.ai/guide: sim-lab       # pick up the simulator pods
  inferencePool:
    failureMode: FailOpen
  epp:
    image:
      tag: v0.10.0
      pullPolicy: IfNotPresent
    flags:
      v: 3                          # log every scheduling decision
    resources:
      requests: {cpu: 200m, memory: 256Mi}
      limits: {memory: 1Gi}
    pluginsConfigFile: sim-lab-plugins.yaml
    pluginsCustomConfig:
      sim-lab-plugins.yaml: |
        apiVersion: llm-d.ai/v1alpha1
        kind: EndpointPickerConfig
        plugins:
        - type: approx-prefix-cache-producer
        - type: inflight-load-producer
        - type: prefix-cache-affinity-filter
        - type: token-load-scorer
        schedulingProfiles:
        - name: default
          plugins:
          - pluginRef: prefix-cache-affinity-filter
          - pluginRef: token-load-scorer
  proxy:
    args: ["--service-node", "envoy-sidecar", "--log-level", "warn",
           "--concurrency", "2", "-c", "/etc/envoy/envoy.yaml"]
    resources:
      requests: {cpu: 100m, memory: 128Mi}
      limits: {memory: 512Mi}
helm upgrade -i sim-lab oci://ghcr.io/llm-d/charts/llm-d-router-standalone \
  --version v0 -n llm-d-sim -f router-values.yaml
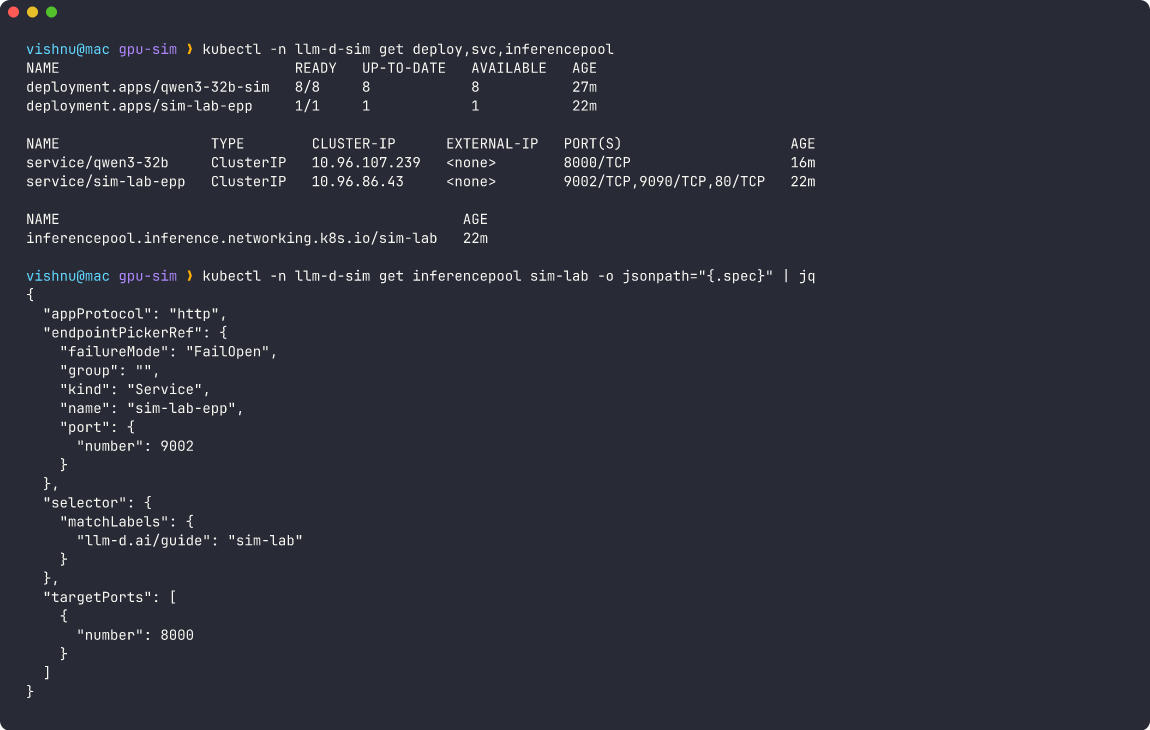
The InferencePool is the model-aware Service: select pods by label, target port 8000, and ask sim-lab-epp which pod to use.
Send a request through the router:
kubectl -n llm-d-sim port-forward svc/sim-lab-epp 8080:80 &
Save the request body as req.json:
{
  "model": "Qwen/Qwen3-32B",
  "messages": [{"role": "user", "content": "How do I drain a Kubernetes node?"}],
  "max_tokens": 24
}
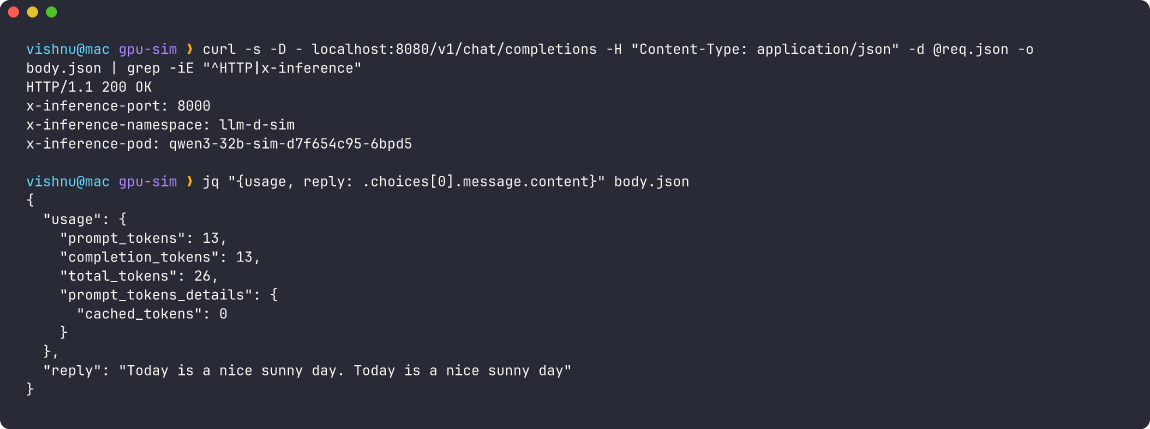
A 200 with the serving pod in the x-inference-pod header. The reply is filler text, which is fine, because routing is what we’re testing.
Two headers make the rest of this post possible:
x-inference-podtells you which pod served the request.usage.prompt_tokens_details.cached_tokenstells you whether it hit the cache.
How one request is routed#
Envoy talks to the EPP through ext_proc (external processing), an Envoy filter that pauses each request, sends its headers and body to an outside gRPC service, and waits for an answer. Here the answer is a pod address.
likely cache this prefix Note over R: score: least token load Note over R: pick: max score R-->>E: x-gateway-destination-endpoint E->>P: forward to that pod IP P-->>C: stream tokens + x-inference-pod
At v: 3 the EPP logs each step. Here the affinity filter cut 8 candidates down to 1:
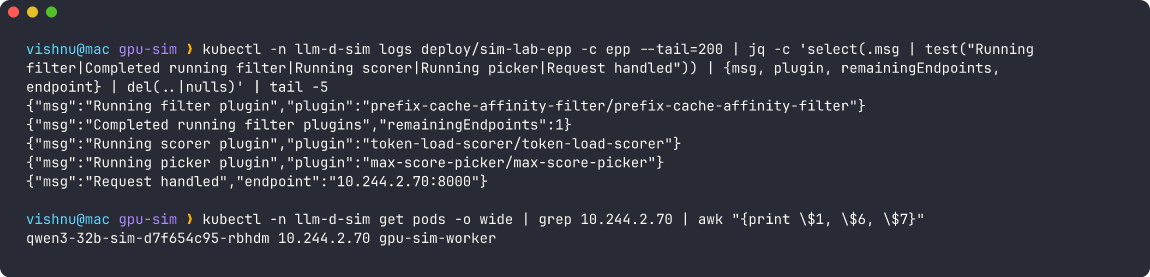
One routing decision: filter → 1 remaining endpoint → score → pick 10.244.2.70, the pod that already held this tenant’s prompt.
The EPP reads the same metrics a real vLLM pod exports:

vLLM metric names, from a simulator. Your Grafana dashboards and alerts work unchanged.
The experiment#
Picture a shared runbook assistant. 16 teams (tenants), each with its own 3,800-token system prompt, ask short questions. Requests arrive from 8 concurrent clients in a fixed random order.
The load generator is ~100 lines of stdlib Python. It runs in a python:3.13-slim pod and prints the pod, cache hits, and TTFT per request:
kubectl -n llm-d-sim run client --image=python:3.13-slim --command -- sleep infinity
kubectl -n llm-d-sim exec client -- sh -c 'apt-get -qq update && apt-get -qq install -y curl'
kubectl cp loadtest.py llm-d-sim/client:/loadtest.py
fixed seed"] e1@--> S["Service qwen3-32b
kube-proxy picks"] L e2@--> R["sim-lab-epp
llm-d picks"] S e3@--> P["same 8 sim pods
cold caches"] R e4@--> P P e5@--> O["hit rate · TTFT
req/s · pod spread"] e1@{ animate: true } e2@{ animate: true } e3@{ animate: true } e4@{ animate: true } e5@{ animate: true } classDef input fill:#13264a,stroke:#38bdf8,color:#e6f6ff; classDef idle fill:#101e27,stroke:#324950,color:#8aa0a8; classDef router fill:#281d48,stroke:#a78bfa,color:#f1edff; classDef gpu fill:#173f59,stroke:#22d3ee,color:#ecfeff; class L,O input; class S idle; class R router; class P gpu;
Gotcha: run the comparison from inside the cluster.
kubectl port-forward svc/qwen3-32bpicks one pod and sends everything there, so it isn’t a fair baseline. Port-forwarding the router is fine, because the router does the spreading.
Reset between runs:
kubectl -n llm-d-sim delete pod -l app=qwen3-32b-sim --wait
kubectl -n llm-d-sim rollout status deploy/qwen3-32b-sim
Watch 12 requests#
First, a slow trace: 3 tenants, one request at a time.
Through the plain Service, kube-proxy picks a pod at random. Tenant 00 visits five different pods and rebuilds its prompt each time:
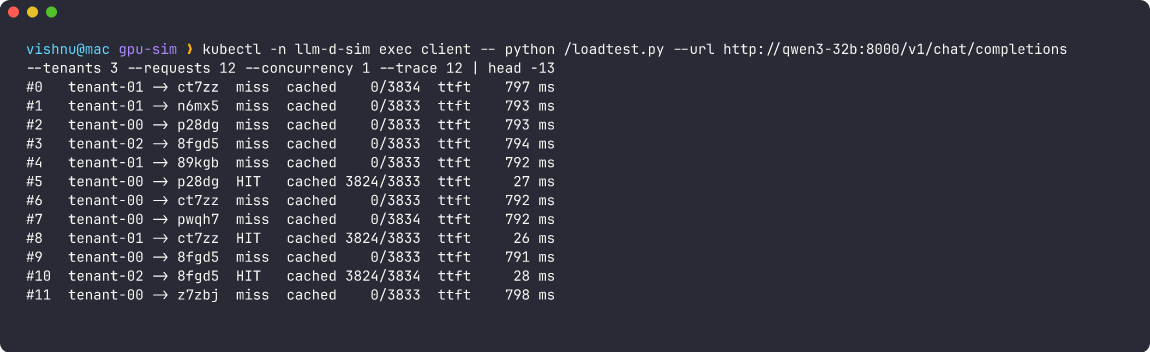
Plain Service: 3 hits out of 12. Every miss costs about 795 ms of prefill.
Through llm-d, each tenant sticks to one pod after its first request:
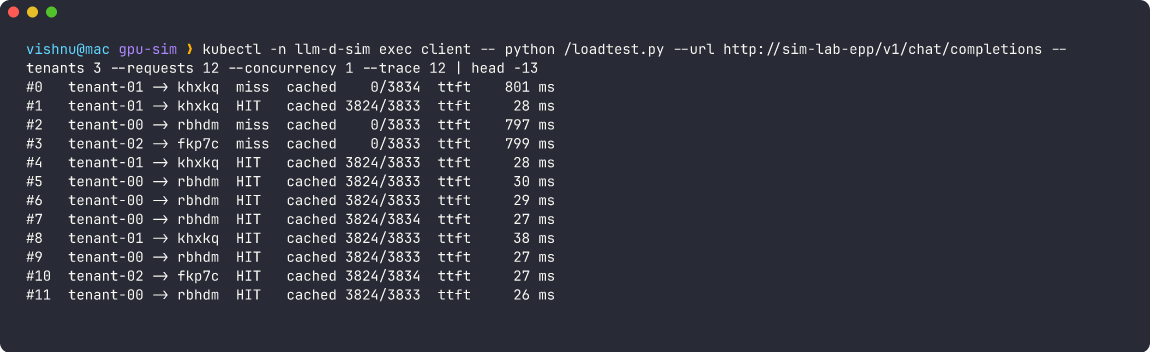
llm-d: 9 hits out of 12. The only misses are each tenant’s very first request.
320 requests, 16 tenants#
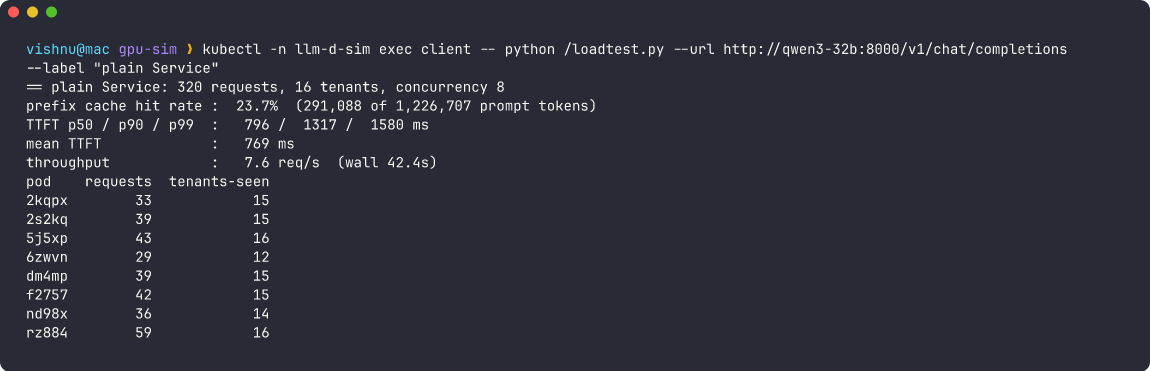
Plain Service: every pod sees nearly all 16 tenants. Its 16k-token cache can’t hold them, so it keeps evicting.
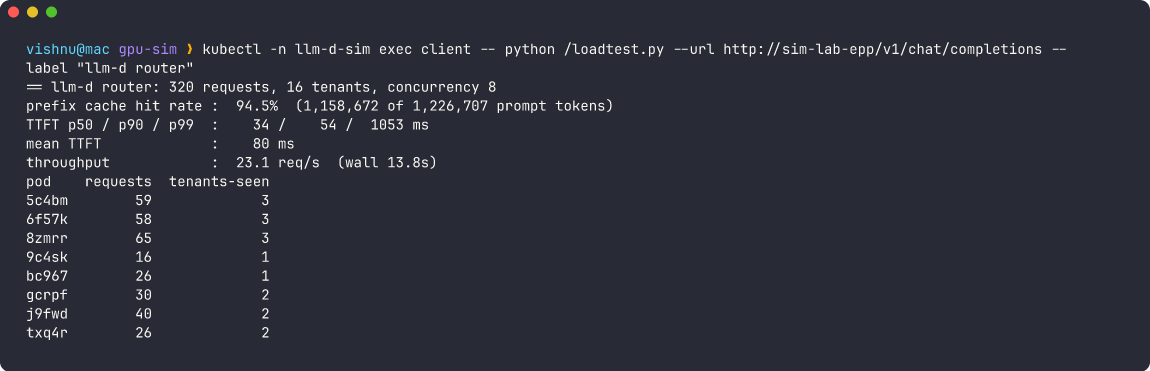
llm-d: each pod sees 1 to 3 tenants. They fit in its cache, so nearly every request is a hit.
| 16 tenants | Plain Service | llm-d |
|---|---|---|
| Prefix cache hit rate | 23.7% | 94.5% |
| TTFT p50 | 796 ms | 34 ms |
| TTFT p90 | 1,317 ms | 54 ms |
| Throughput | 7.6 req/s | 23.1 req/s |
Same pods and same cache size: 3x the throughput. llm-d effectively turned eight 16k-token caches into one 128k-token cache by giving each pod its own slice of the tenants.
When llm-d loses#
Now flip the traffic: one hot tenant, 24 concurrent clients, 200 requests. Picture a single popular app.
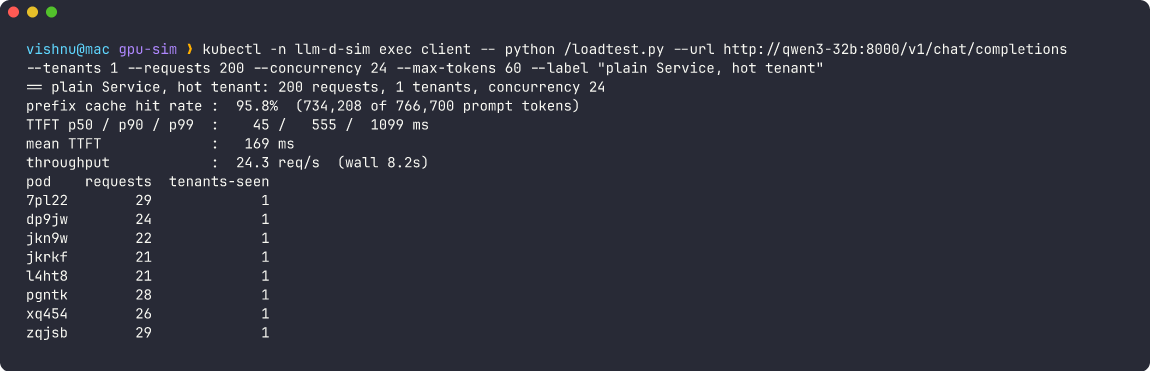
Plain Service: random spreading warms all 8 pods with one miss each, and then every pod helps.
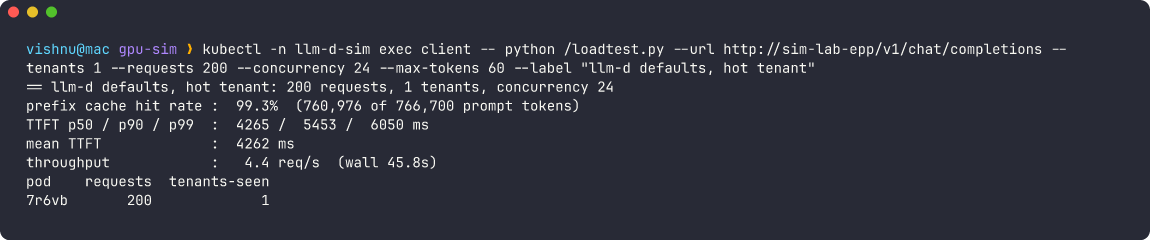
llm-d defaults: all 200 requests on one pod. 99% cache hits, and a 4.3-second TTFT from queueing.
5x worse than the plain Service. llm-d had a perfect cache hit rate and still lost, because the requests piled up in one pod’s queue.
The affinity filter is meant to break stickiness when the sticky pod gets slow. That check is the TTFT load gate, and it didn’t fire. The filter’s docs explain why:
sticky pod has the prefix"} F e2@--> G{"TTFT gate
est. TTFT = in-flight tokens
÷ peakPrefillThroughput"} G e3@-->|"sticky slower by
> maxTTFTPenaltyMs?"| B["Break stickiness
all 8 pods eligible"] G e4@-->|"no: default 18,000 ms"| S["Stay sticky
queue grows"] e1@{ animate: true } e2@{ animate: true } e3@{ animate: true } e4@{ animate: true } classDef input fill:#13264a,stroke:#38bdf8,color:#e6f6ff; classDef router fill:#281d48,stroke:#a78bfa,color:#f1edff; classDef gpu fill:#173f59,stroke:#22d3ee,color:#ecfeff; classDef warn fill:#302410,stroke:#fbbf24,color:#fff3cf; class R input; class F,G router; class B gpu; class S warn;
Two settings decide this:
peakPrefillThroughput: tokens per second one pod can prefill. The default,15928, was measured for Qwen3-32B on H100s.maxTTFTPenaltyMs: how much slower the sticky pod may get before the router spreads. The default is 18 seconds.
Calibrate with the official script#
llm-d ships a calibration Job. It sends uncacheable prompts and measures real prefill speed. It works against the simulator too:
git clone --depth 1 --branch v0.10.0 https://github.com/llm-d/llm-d.git
GUIDE_NAME=sim-lab NAMESPACE=llm-d-sim CHUNK_SIZE=4096 \
  ./llm-d/guides/recipes/router/calibration/calibrate.sh
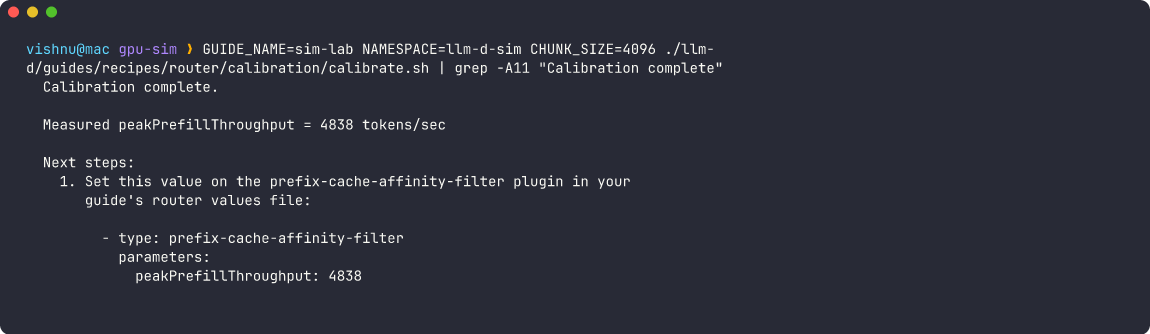
4,838 tokens/s. The sim’s settings predict 4,096 ÷ (20 ms + 4,096 × 0.2 ms) ≈ 4,880. The calibration Job measured the simulator correctly.
Calibration alone didn’t fix the hot tenant. With the measured value and a 2-second penalty, all 200 requests still went to one pod:
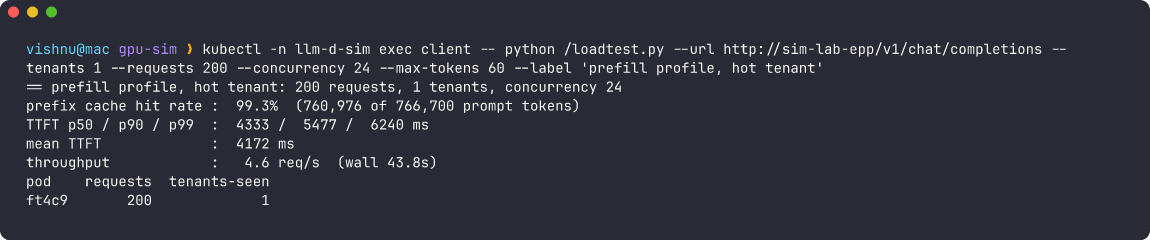
Calibrated, still stuck on one pod. The gate measures prefill pressure, and this pod’s problem is decode.
On the 16-tenant traffic, the same calibrated profile did as well as the defaults:

Calibrated prefill profile on 16 tenants: 94.5% hits and 49 ms p90 TTFT.
The filter’s README covers this case: use token-load-scorer for prefill-bound traffic and active-request-scorer for decode-bound traffic. A hot, fully cached prefix is decode-bound. So I made a second profile:
         - type: prefix-cache-affinity-filter
+          parameters:
+            peakPrefillThroughput: 4838   # from calibrate.sh
+            maxTTFTPenaltyMs: 1000        # default 18000
-        - type: token-load-scorer
+        - type: active-request-scorer
         schedulingProfiles:
         - name: default
           plugins:
           - pluginRef: prefix-cache-affinity-filter
-          - pluginRef: token-load-scorer
+          - pluginRef: active-request-scorer
helm upgrade sim-lab oci://ghcr.io/llm-d/charts/llm-d-router-standalone \
  --version v0 -n llm-d-sim -f router-values-decode.yaml
kubectl -n llm-d-sim rollout restart deploy/sim-lab-epp
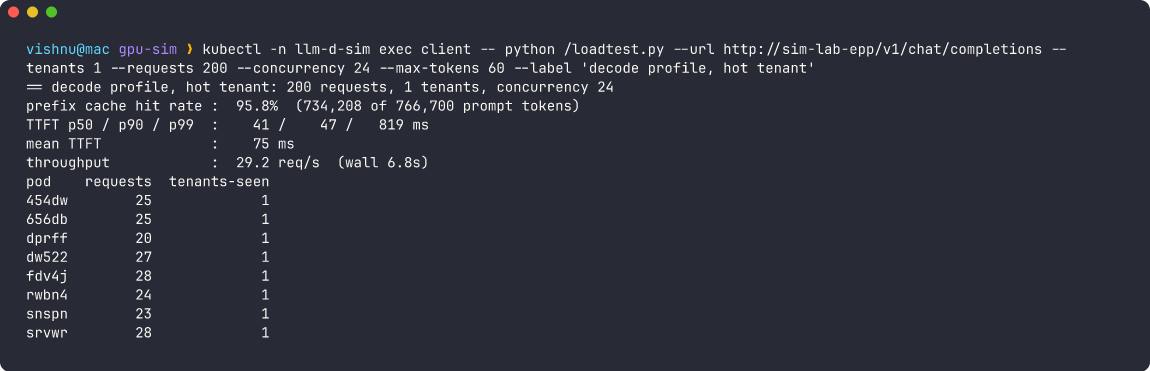
Decode profile: spread across all 8 pods, p90 TTFT 47 ms, 29.2 req/s. Better than the plain Service.
It costs something on the 16-tenant workload, though:

Decode profile on 16 tenants: hit rate drops to 78%, because it spreads requests that should have stayed sticky.
The scoreboard#
Every number below comes from a screenshot in this post. Each run started with cold caches.
| Router config | 16 tenants: hit rate | 16 tenants: p90 TTFT | 16 tenants: req/s | Hot tenant: p90 TTFT | Hot tenant: req/s |
|---|---|---|---|---|---|
| Plain Service | 23.7% | 1,317 ms | 7.6 | 555 ms | 24.3 |
| llm-d defaults | 94.5% | 54 ms | 23.1 | 5,453 ms | 4.4 |
| llm-d prefill profile (calibrated, 2 s gate) | 94.5% | 49 ms | 21.8 | 5,477 ms | 4.6 |
| llm-d decode profile (active-request, 1 s gate) | 78.2% | 793 ms | 17.8 | 47 ms | 29.2 |
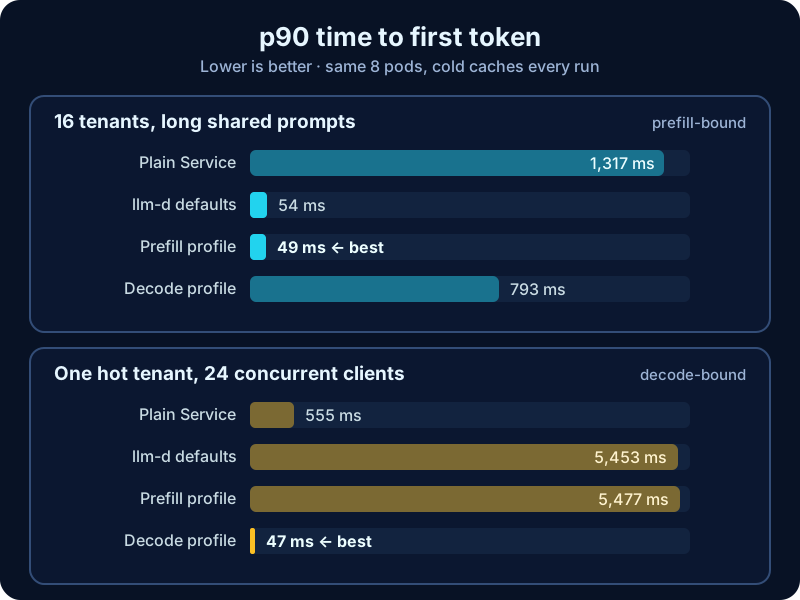
The same four configs on two traffic patterns. Each workload has a different winner.
No config wins both workloads. Router tuning is a choice about your traffic mix, and the simulator let me find that out in under a minute per run instead of renting 16 H100s.
traffic look like?"} e1@-->|"many apps or tenants,
long shared prompts"| P["Prefill-bound
token-load-scorer
calibrate peakPrefillThroughput"] Q e2@-->|"few hot prompts,
long answers, high concurrency"| D["Decode-bound
active-request-scorer
lower maxTTFTPenaltyMs"] Q e3@-->|"short unique prompts"| N["No shared prefix
a plain Service is fine"] e1@{ animate: true } e2@{ animate: true } e3@{ animate: true } classDef router fill:#281d48,stroke:#a78bfa,color:#f1edff; classDef gpu fill:#173f59,stroke:#22d3ee,color:#ecfeff; classDef warn fill:#302410,stroke:#fbbf24,color:#fff3cf; classDef idle fill:#101e27,stroke:#324950,color:#8aa0a8; class Q router; class P gpu; class D warn; class N idle;
Bonus: GPU dashboards without GPUs#
The fake operator’s DCGM exporter publishes the same DCGM_FI_DEV_* series as NVIDIA’s, labelled with the pod that owns each GPU:
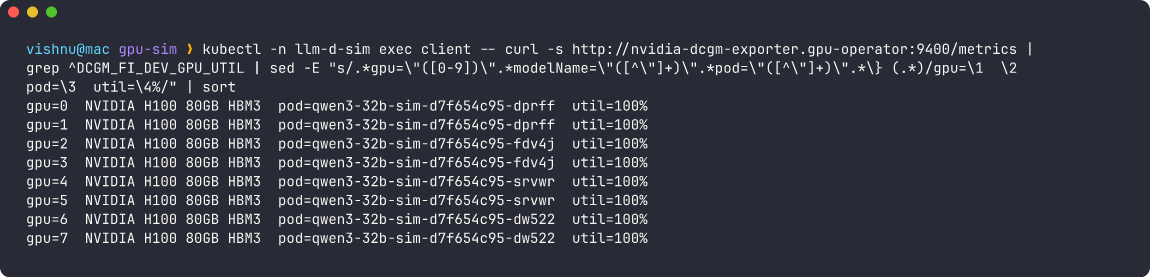
Per-GPU utilization mapped to pods, ready for Prometheus and Grafana. It reads 100% by default.
To make the numbers move, annotate pods with run.ai/simulated-gpu-utilization: "10-30". You can then build and test GPU alerts before you own a GPU.
What a simulator can’t tell you#
Simulators answer “does my platform behave correctly?” They don’t answer “how fast is my model?”
| You can trust the lab for | You can’t trust the lab for |
|---|---|
| Scheduling, quotas, Pending pods, rollouts | Real tokens/s or TTFT for your model |
| Which pod the router picks, and why | GPU memory pressure and OOMs |
| Cache hit rates under your traffic shape | CUDA kernels, NCCL, tensor parallelism |
| Router and autoscaler config changes | Answer quality |
| Metrics, dashboards, alerts | Network effects (RDMA, KV transfer cost) |
Two more caveats from this run:
- The sim’s latency is what you configure. Set
prefill-time-per-tokenandinter-token-latencyfrom a real benchmark of your model, or use the ready-made profiles. Mymax-num-seqs=4exaggerates saturation compared with real vLLM. - Without
--render-url, the sim uses a fake tokenizer and logs a warning. That’s fine for the approximate prefix routing used here. For precise prefix-cache routing, which compares real token hashes, run the vLLM render sidecar shown in the sim’sdeployment.yaml.
When the lab says your config is right, rent a GPU by the hour, apply the same manifests, and measure the parts that need real hardware.
The load generator#
Save it as loadtest.py. It uses only the standard library.
"""Tiny load generator: N tenants, each with a long shared system prompt.

Sends the same request sequence to a target URL and reports which pod served
each request, prefix-cache hits, and time to first token (TTFT).
Stdlib only, so it runs in a plain python:3.13-slim pod.
"""
import argparse, collections, json, random, statistics, threading, time, urllib.request

WORDS = ("node drain cordon pod deployment rollout restart replica service ingress "
         "secret configmap volume claim taint toleration affinity quota limit probe "
         "readiness liveness gpu driver kernel upgrade backup restore alert page "
         "oncall escalate rollback canary metrics logs trace dashboard").split()


def system_prompt(tenant, words=3800):
    rnd = random.Random(tenant)
    body = " ".join(rnd.choice(WORDS) for _ in range(words))
    return f"[tenant-{tenant:02d}] You are the runbook assistant for team {tenant}. Runbook: {body}"


QUESTIONS = ["How do I drain a node?", "What are the pre-upgrade checks?",
             "How do I roll back a deploy?", "Who do I page for GPU alerts?",
             "How do I restore from backup?", "Why is the pod not ready?"]


def one_request(url, model, tenant, q, max_tokens):
    body = json.dumps({
        "model": model, "stream": True, "max_tokens": max_tokens,
        "stream_options": {"include_usage": True},
        "messages": [{"role": "system", "content": system_prompt(tenant)},
                     {"role": "user", "content": q}],
    }).encode()
    req = urllib.request.Request(url, body, {"Content-Type": "application/json"})
    t0 = time.perf_counter(); ttft = None; usage = {}
    with urllib.request.urlopen(req, timeout=120) as r:
        pod = r.headers.get("x-inference-pod", "?")
        for line in r:
            line = line.strip()
            if not line.startswith(b"data:") or line == b"data: [DONE]":
                continue
            chunk = json.loads(line[5:])
            if ttft is None and chunk.get("choices"):
                ttft = time.perf_counter() - t0
            if chunk.get("usage"):
                usage = chunk["usage"]
    prompt = usage.get("prompt_tokens", 0)
    cached = (usage.get("prompt_tokens_details") or {}).get("cached_tokens", 0)
    return dict(tenant=tenant, pod=pod, ttft=ttft, e2e=time.perf_counter() - t0,
                prompt=prompt, cached=cached)


def pct(xs, p):
    xs = sorted(xs); return xs[min(len(xs) - 1, int(round(p / 100 * (len(xs) - 1))))]


def main():
    ap = argparse.ArgumentParser()
    ap.add_argument("--url", required=True)
    ap.add_argument("--label", default="run")
    ap.add_argument("--model", default="Qwen/Qwen3-32B")
    ap.add_argument("--tenants", type=int, default=16)
    ap.add_argument("--requests", type=int, default=320)
    ap.add_argument("--concurrency", type=int, default=8)
    ap.add_argument("--max-tokens", type=int, default=30)
    ap.add_argument("--seed", type=int, default=7)
    ap.add_argument("--trace", type=int, default=0, help="print the first N requests")
    a = ap.parse_args()

    rnd = random.Random(a.seed)
    jobs = [(rnd.randrange(a.tenants), rnd.choice(QUESTIONS)) for _ in range(a.requests)]
    results, lock, it = [], threading.Lock(), iter(enumerate(jobs))

    def worker():
        while True:
            with lock:
                nxt = next(it, None)
            if nxt is None:
                return
            i, (t, q) = nxt
            r = one_request(a.url, a.model, t, q, a.max_tokens)
            r["i"] = i
            with lock:
                results.append(r)

    t0 = time.perf_counter()
    threads = [threading.Thread(target=worker) for _ in range(a.concurrency)]
    [t.start() for t in threads]; [t.join() for t in threads]
    wall = time.perf_counter() - t0
    results.sort(key=lambda r: r["i"])

    for r in results[:a.trace]:
        hit = "HIT " if r["cached"] > r["prompt"] / 2 else "miss"
        print(f"#{r['i']:<3} tenant-{r['tenant']:02d} -> {r['pod'][-5:]}  {hit}  "
              f"cached {r['cached']:>4}/{r['prompt']:<4}  ttft {r['ttft']*1000:6.0f} ms")
    if a.trace:
        print()

    ttfts = [r["ttft"] for r in results]
    prompt = sum(r["prompt"] for r in results); cached = sum(r["cached"] for r in results)
    per_pod = collections.Counter(r["pod"][-5:] for r in results)
    tenants_per_pod = collections.defaultdict(set)
    for r in results:
        tenants_per_pod[r["pod"][-5:]].add(r["tenant"])

    print(f"== {a.label}: {len(results)} requests, {a.tenants} tenants, concurrency {a.concurrency}")
    print(f"prefix cache hit rate : {cached / prompt:6.1%}  ({cached:,} of {prompt:,} prompt tokens)")
    print(f"TTFT p50 / p90 / p99  : {pct(ttfts,50)*1000:5.0f} / {pct(ttfts,90)*1000:5.0f} / {pct(ttfts,99)*1000:5.0f} ms")
    print(f"mean TTFT             : {statistics.mean(ttfts)*1000:5.0f} ms")
    print(f"throughput            : {len(results)/wall:5.1f} req/s  (wall {wall:.1f}s)")
    print("pod    requests  tenants-seen")
    for pod in sorted(per_pod):
        print(f"{pod}  {per_pod[pod]:>8}  {len(tenants_per_pod[pod]):>12}")


if __name__ == "__main__":
    main()
The runs in this post:
# 16 tenants (default): the plain Service, then the router
kubectl -n llm-d-sim exec client -- python /loadtest.py \
  --url http://qwen3-32b:8000/v1/chat/completions --label "plain Service"
kubectl -n llm-d-sim exec client -- python /loadtest.py \
  --url http://sim-lab-epp/v1/chat/completions --label "llm-d router"

# one hot tenant
kubectl -n llm-d-sim exec client -- python /loadtest.py \
  --url http://sim-lab-epp/v1/chat/completions \
  --tenants 1 --requests 200 --concurrency 24 --max-tokens 60

# the 12-request trace
kubectl -n llm-d-sim exec client -- python /loadtest.py \
  --url http://sim-lab-epp/v1/chat/completions \
  --tenants 3 --requests 12 --concurrency 1 --trace 12
Clean up#
kind delete cluster --name gpu-sim
colima stop
Cheat sheet#
kind                  = Kubernetes nodes as Docker containers
fake-gpu-operator     = nvidia.com/gpu, nvidia-smi, DCGM metrics, no GPU
llm-d-inference-sim   = vLLM's API + metrics + prefix cache, no model
EPP                   = Endpoint Picker: llm-d's router brain, picks the pod
Envoy                 = the proxy that asks the EPP, then forwards
ext_proc              = the Envoy hook Envoy uses to ask the EPP
x-inference-pod       = which pod served the request
cached_tokens         = did it hit the prefix cache
calibrate.sh          = measures peakPrefillThroughput, works on the sim
prefill-bound traffic = token-load-scorer, stay sticky
decode-bound traffic  = active-request-scorer, lower maxTTFTPenaltyMs
the lab can't tell you = real speed, memory, CUDA, quality
Fake the GPU and the model. Keep everything else real. That’s enough to learn how the platform behaves without renting a GPU.